

Table of Contents
- Side Scan vs Down Scan: Key Differences at a Glance
- How Side Scan Sonar Works
- How Down Scan Sonar Works
- How to Read Fish Finder Sonar Imagery
- Side Scan vs Down Scan: Practical Use Cases
- Best Marine GPS for Fishing: Choosing the Right Sonar System
- Transducer Selection and Environmental Limitations
- Frequently Asked Questions
Last Updated: September 30, 2026
Side Scan vs Down Scan: Key Differences at a Glance
Side scan vs down scan explained: two distinct sonar technologies that reveal the underwater world differently. At Elliott's Tackle & Rigging, we help serious anglers choose the right transducer for their needs.
Down scan creates a vertical picture directly beneath your hull. Side scan sweeps both sides of the boat in a wider horizontal plane. Most modern transducers combine both technologies.
Down scan excels at showing fish arches, baitfish balls, and bottom composition. Side scan reveals structure and weedlines from a distance. Use down scan when actively fishing; use side scan when searching for productive water.
| Feature | Down Scan | Side Scan |
|---|---|---|
| Coverage | Directly below hull | 500 ft left and right |
| Best for | Fish identification | Structure hunting |
| Frequency | 800 kHz typical | 455 kHz typical |
| Depth range | 200-750 ft | 500 ft coverage |
| Resolution | Ultra-detailed | Wide perspective |
How Side Scan Sonar Works
Side scan transmits a signal outward from your transducer, perpendicular to the boat's direction. The signal bounces off the lake or ocean floor and returns as a digital image that resembles an aerial photograph of the bottom.
Coverage Area and Beam Width
Side scan operates with a wide beam width, typically 50 degrees or more, letting you see 500 feet or more to each side of the boat.
Lower frequencies like 455 kHz produce wider beams but less detail. Higher frequencies like 1200 kHz create narrower beams with sharper definition. The tradeoff is range versus resolution.
Most recreational anglers use 455 kHz transducers, which balance coverage area with enough definition to spot structure, weedlines, and target separation.
Frequency and Resolution Trade-offs
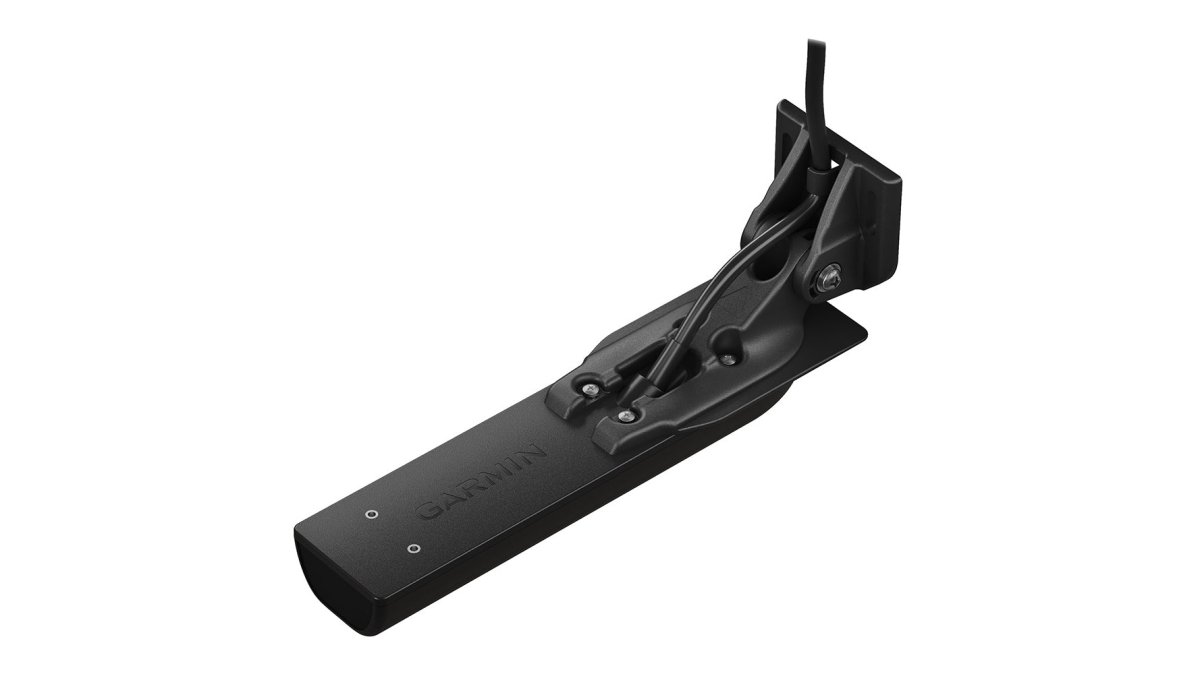
The Garmin GT36UHD-TM offers three selectable frequencies: 455 kHz, 800 kHz, and 1 MHz, letting you balance range and resolution based on water depth and bottom type.

At 455 kHz, you get maximum range (up to 500 feet on each side) for searching productive areas, though fine detail like individual rocks is limited.
At 800 kHz, range drops to around 300 feet but resolution jumps, making bottom composition and structure types clearer.
At 1 MHz, range shrinks to 150 feet but image clarity rivals down scan, ideal for shallow water.
How Down Scan Sonar Works
Down scan points straight down beneath your boat, creating a detailed vertical picture where you see fish arches, baitfish, suspended structure, and bottom composition.
Down scan uses higher frequencies (typically 800 kHz or higher) with a narrow cone angle that produces photo-like resolution for straightforward fish identification.
Garmin GT30-TM DownVü™/SideVü™ 12-Pin →
Vertical Imaging and Cone Angle
The cone angle in down scan is tight (usually under 3 degrees), imaging a small footprint directly beneath the transducer and building a continuous picture as you move.
Fish appear as distinctive arches in down scan imagery. Experienced anglers read these arches instantly to determine fish position, size, and swimming direction.
Hard bottom like rock or clay appears bright; soft bottom like mud or sand appears darker. Weedlines create distinctive layered patterns showing vegetation density and height.
Depth Range and Target Separation
The Garmin GT54UHD-TM's 800 kHz ClearVü element reaches 200 feet with excellent definition. Lower frequencies work deeper but sacrifice resolution.

Target separation, distinguishing between two separate objects, is where down scan shines. Two fish swimming close together show as distinct arches rather than a merged blob.
This matters when fishing baitfish balls or dense structure, letting you see individual fish within a school and judge their size.
Boat speed affects down scan readability. Most anglers slow to 2-4 mph when actively fishing to let the sonar paint a clear picture.
How to Read Fish Finder Sonar Imagery
Reading sonar imagery takes practice. Fish arches, structure, and bottom composition have distinctive visual signatures.
Identifying Fish Arches and Structure
Fish arches are the most recognizable sonar signature. A fish swimming through the beam appears as an arc that darkens at center then lightens as it exits, revealing position and movement.
A tight, compact arch means a single fish. A wider, flatter arch suggests a larger fish or multiple fish close together. Vertically stacked arches indicate a school of suspended fish.
Structure shows as hard targets with strong signal returns. Vertical structures like stumps create bright vertical lines. Horizontal features like ledges show as bright bands with shadows beneath.
Shadows are important. The area behind a hard object blocks the sonar signal. Experienced anglers use shadows to judge structure size and shape.
Interpreting Bottom Composition and Weedlines
Hard bottom like rock or clay bounces signals back strong, appearing bright. Soft bottom like mud or sand absorbs more signal, appearing darker.
Weedlines create layered patterns on your sonar display. Dense weed appears darker and thicker; sparse weed shows as thinner lines. The height of the weed band indicates vegetation height.
Garmin GT30-TM DownVü™/SideVü™ 12-Pin →
Fish often position on transitions between bottom types. These transition zones show clearly on sonar, giving you specific targets to fish.
Noise appears as random speckles; interference from other boats shows as diagonal lines or bands.
Side Scan vs Down Scan: Practical Use Cases
Both sonar types solve different problems. Understanding when to use each one makes you a more effective angler.
When to Use Side Imaging
Use side scan when searching for productive water. As you cruise at 5-10 mph, side scan reveals structure, weedlines, and bottom composition across a wide area.
When to Use Down Imaging
Use down scan when you've located a promising spot. Down scan shows fish position, size, and behavior in real time.
Best Marine GPS for Fishing: Choosing the Right Sonar System
Modern transducers combine multiple sonar types in a single unit, giving you flexibility without multiple installations.
Transducer Selection and Environmental Limitations
Transducer choice matters, but so does understanding what limits sonar performance. Water conditions, bottom type, and boat speed all affect how well your sonar works.
Frequency Selection for Shallow vs Deep Water
Frequency selection is your primary tool for adapting to water depth. Shallow water demands higher frequencies for definition. Deep water requires lower frequencies for range.
Noise, Interference, and Gain Settings
Gain settings control sonar sensitivity. Too much gain and the image fills with noise, random speckles that make it hard to read. Too little gain and weak signals disappear, missing subtle structure and small fish.
Frequently Asked Questions
What is the main difference between side scan and down scan sonar?
Side scan sonar transmits a signal horizontally to the left and right of your boat, creating a wide coverage area that stretches up to 500 feet on each side. Down scan (also called ClearVü) transmits straight down beneath the hull, producing a narrow but highly detailed image of what's directly below. Side scan excels at finding structure and mapping larger areas; down scan provides clarity on fish and bottom composition directly under your boat. Most modern transducers combine both technologies for comprehensive sonar coverage.
How do you read fish finder sonar to identify fish versus structure?
Fish typically appear as distinct arches on traditional sonar or as individual targets on scanning sonar. Structure, rocks, logs, weedlines, and bottom composition, shows as solid masses or layered returns. On side scan, baitfish balls appear as tight clusters, while structure creates sharp, well-defined shadows. Down scan shows fish as small bright targets suspended in the water column, while bottom material displays as a consistent, textured band. Gain settings and palette selection help separate targets from noise. Practice interpreting your specific sonar's color palette and signal return patterns to build confidence.
Is side imaging worth the investment for saltwater and freshwater fishing?
Side imaging is worth the investment if you fish structure-heavy areas, troll large zones, or need to locate baitfish concentrations before dropping down. The ability to scan 500 feet on each side saves time and fuel. However, if you fish shallow, confined areas or primarily need to verify what's directly beneath you, down imaging alone may suffice. Modern all-in-one transducers like the Garmin GT54UHD-TM ($449.99) combine side and down imaging, making the investment more practical than choosing one technology alone. The Raymarine RV-100 ($397.99) offers similar capability with built-in motion compensation for rough water.
What are the disadvantages of side scan sonar in shallow water?
Side scan's main weakness in shallow water is reduced effective range. In depths under 15 feet, the signal may not extend the full 500-foot coverage, and interference from surface turbulence or shallow bottom reflections can clutter the image. Frequency selection matters: 455 kHz penetrates deeper but with less detail; 800 kHz provides sharper imagery but limited range in very shallow areas. Gain adjustments and noise reduction settings become critical to filter out false targets. Down imaging often outperforms side scan in water shallower than 20 feet because the cone angle provides clearer target separation in confined depths.
Can you use side scan and down scan sonar simultaneously while trolling?
Yes. Modern transducers and chartplotters support simultaneous side and down imaging during trolling. The Garmin GT54UHD-TM and GT36UHD-TM both deliver side and down scanning at the same time, allowing you to monitor structure to the sides while watching for fish beneath the hull. Many anglers split the display to show both views or toggle between them. Operating both simultaneously uses more power and can increase digital signal processing demand, but modern systems handle this without issue. Scroll speed adjustments help you maintain boat speed awareness while interpreting both imaging types in real time.
0 comments