

Table of Contents
- Understanding Sonar Basics: How Fish Finders Work
- Fish Finder Color Meaning: Interpreting Your Display
- How to Identify Fish on Sonar: Reading Arches and Targets
- Garmin Sonar Settings for Beginners: Getting Started
- Humminbird Fish Finder Tips: Maximizing Your Screen
- Reading Bottom Structure and Hardness Across All Brands
- Common Mistakes When Reading Sonar Fish Finders
- Conclusion: Mastering Your Fish Finder
How to Read a Sonar Fish Finder: Garmin, Humminbird & Furuno
Last Updated: July 11, 2026
Learning to read sonar fish finder displays is one of the most valuable skills you can develop as an angler. The difference between a fisherman who understands their sonar and one who doesn't often determines success on the water.
Understanding Sonar Basics: How Fish Finders Work
Fish finders use ultrasound technology to create a picture of what's beneath your vessel. A transducer mounted on your hull sends sound waves downward through the water column. When those waves hit something, a fish, the bottom, vegetation, or debris, they bounce back as electrical signals. Your fish finder's processor converts these signals into the visual display you see on screen.
CHIRP technology (Compressed High Intensity Radar Pulse) is the standard in modern fish finders. Unlike older single-frequency systems, CHIRP transmits a range of frequencies simultaneously, giving you clearer target separation, better detail on structure, and reduced noise. Garmin's CHIRP sonar, Humminbird's MEGA imaging, and Furuno's advanced frequency systems all use variations of this principle.
The transducer is your sonar's eyes. Transducer placement and orientation matter enormously. A transducer mounted too far aft, at the wrong angle, or in turbulent water will give you unreliable data. Most quality installations place the transducer on the transom or through-hull where water flow is clean and consistent.
Down-Imaging vs. Side-Imaging: What's the Difference?
Down-imaging sends sound waves straight down beneath your vessel, showing a vertical slice of the water column directly under your boat. This is your primary view for identifying fish, reading bottom hardness, and spotting thermoclines.
Side-imaging transmits sonar signals to the sides of your vessel, creating a horizontal view of structure and fish to port and starboard. Side-imaging excels at finding objects, vegetation, and fish positioned away from your direct path. For most anglers starting out, down-imaging is where you'll spend 90% of your attention. Once comfortable reading the water column and identifying targets, side-imaging becomes a powerful supplementary tool.
Fish Finder Color Meaning: Interpreting Your Display
Colors on your sonar display represent signal strength. Strong returns (hard objects, dense targets) appear as warm colors. Weak returns appear as cool colors. The exact palette varies by brand, but the principle is universal.
Red, Yellow, and Blue: What Each Color Tells You
Red indicates the strongest sonar returns. Hard bottom, rock, clay, and packed sand show as red. A large fish or tight baitfish school will also register red.
Yellow represents medium-strength returns. Softer bottom, mud, silt, and loose sand typically show yellow. A single mid-sized fish or loose school of smaller baitfish might appear yellow.
Blue shows weak returns. Very soft bottom, sparse vegetation, or individual small baitfish appear blue. Black or the absence of color indicates no return at all, empty water column.
Gain and Sensitivity Settings Across Brands
Gain controls how much the sonar amplifies the returning signal before displaying it. Turn gain up too high and you'll see noise everywhere. Turn it down too low and you'll miss targets.
Garmin units typically label this as "Gain" or "Sensitivity." Humminbird calls it "Sensitivity." Furuno uses "Gain." The terminology differs, but the function is identical. A good starting point is to adjust gain until you see a light gray background in the water column with occasional noise speckles, then back it off slightly.
How to Identify Fish on Sonar: Reading Arches and Targets
A moving fish creates an arc shape on the display as your boat moves past it. A complete arch, starting at the bottom of the cone, rising to a peak, and descending again, indicates a single fish that your boat passed directly over.
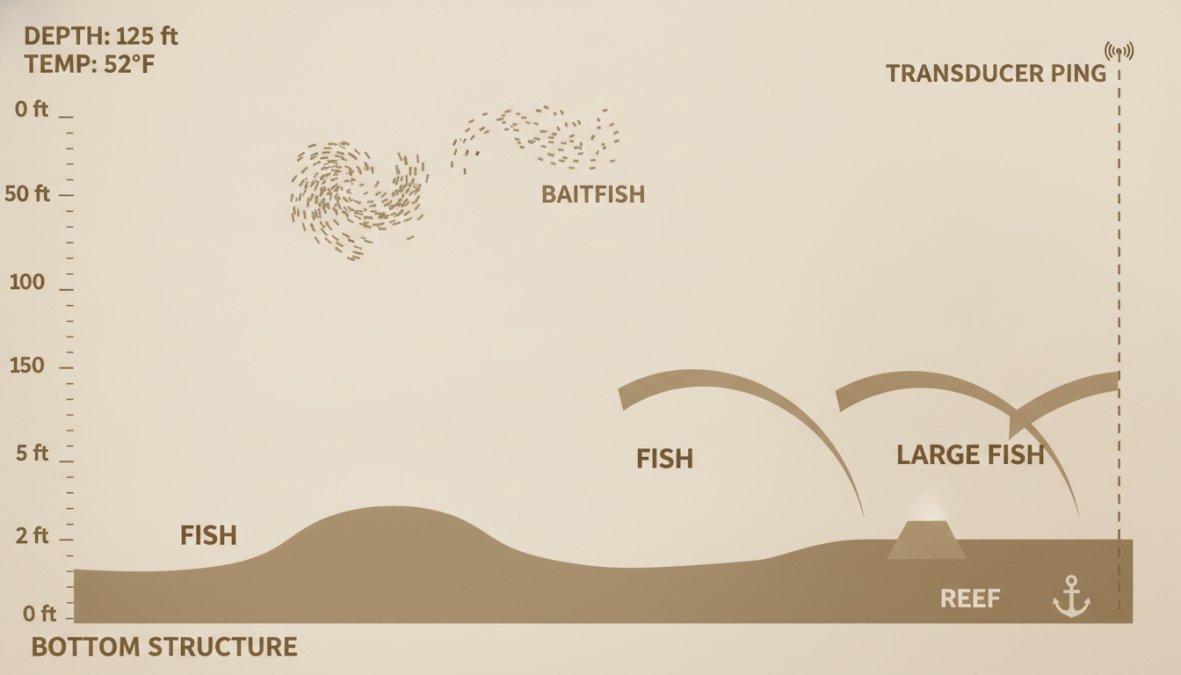
The height and thickness of the arch tell you something about the fish's size. A tall, thick arch suggests a larger fish. A short, thin arch suggests a smaller fish.
Recognizing Fish Arches vs. Noise and Debris
Not every arc on your screen is a fish. Vegetation, suspended debris, and noise can create arch-like patterns. A true fish arch appears as a smooth, continuous curve. Noise appears as random speckles or jagged lines. Vegetation shows as a cloud or fuzzy area with a defined top edge.
Baitfish schools appear as dense clouds of color, usually yellow or orange. If you're seeing arches suspended 15 feet above the bottom in open water, they're almost certainly fish. If you're seeing arches right on the bottom line, they might be targets on structure or noise from a rough bottom.
Understanding the Water Column and Thermocline
The water column is the vertical slice of water beneath your boat from surface to bottom. On your display, the left side represents the surface and the right side represents the bottom.
A thermocline is a distinct layer where water temperature changes rapidly. Fish often congregate near thermoclines because they mark the boundary between different water masses. On sonar, a thermocline typically shows as a distinct line or band of color running horizontally across your screen. Identifying a thermocline is useful because it tells you where fish are likely concentrated.
Garmin Sonar Settings for Beginners: Getting Started
Garmin fish finders are known for straightforward interfaces and reliable performance. The fundamental sonar settings follow similar logic across their product line.
Frequency Selection: High vs. Low for Different Depths
Garmin units typically offer a choice between high frequency (200 kHz) and low frequency (50 kHz). High frequency provides excellent detail in shallow water but has limited range. Low frequency penetrates deeper water effectively but with less detail.
Use high frequency in shallow water (under 30 feet) where you want maximum detail. Use low frequency in deeper water (over 50 feet) where you need range. Garmin's CHIRP technology lets you transmit multiple frequencies simultaneously for the benefits of both detail and range.
Scrolling Speed and Target Separation on Garmin Units
Scrolling speed controls how fast the sonar history moves across your display. Faster scrolling shows more history but makes detail harder to see. Slower scrolling shows less history but gives you a clearer view of what's happening now.
For structure fishing where you're moving slowly, a slower scrolling speed works better. For open-water fishing where you're moving faster, a moderate scrolling speed keeps the display moving with your boat.
Humminbird Fish Finder Tips: Maximizing Your Screen
Humminbird units are popular among serious anglers because of their exceptional screen clarity and intuitive controls. Their side-imaging integration and MEGA imaging technology set them apart.
Cone Angle and Transducer Placement Best Practices
Cone angle is the width of the sonar beam transmitted from your transducer. A narrow cone (typically 20 degrees) covers a small area with high detail. A wide cone (typically 40-60 degrees) covers a larger area with less detail.
Narrower cones are better for deep water where you want precise target location. Wider cones are better for shallow water where coverage matters more. Transducer placement should follow the manufacturer's specifications precisely. A transducer mounted at the wrong angle will give you distorted images.
Reducing Interference and Noise on Humminbird Displays
Noise typically appears as random speckles or a grainy background, usually from improper gain settings, electrical interference, or transducer issues. Gain adjustment is your first troubleshooting step. If the display looks noisy, try reducing gain slightly.
Electrical interference can come from other electronics on your boat. Check your electrical connections if you're seeing persistent noise. Loose connections or corroded terminals can introduce noise.
Reading Bottom Structure and Hardness Across All Brands
Bottom hardness is one of the most useful pieces of information sonar provides. Hard bottom (rock, clay, packed sand) typically indicates structure where fish congregate. Soft bottom (mud, silt) often means fewer fish but can still hold them depending on the season.
Hard bottom shows as strong color returns: red, bright yellow, or orange. A rocky bottom appears as a thick, bright line. Soft bottom shows as weaker returns: yellow, light orange, or blue.
Soft Bottom, Hard Bottom, and Structure Identification
Structure refers to anything that breaks up the bottom, rocks, logs, vegetation, changes in depth. Structure is where fish live. On sonar, structure shows as irregularities in the bottom line. A smooth, consistent bottom line means featureless bottom. A jagged, irregular bottom line means structure.
Vegetation appears as a distinct layer above the bottom with a defined top edge. Points and ledges show as changes in the depth line. These transitions are where fish stage, especially during migration periods.
Furuno Sonar Interpretation for Structure Fishing
Furuno units are workhorses on commercial and serious recreational vessels. Their sonar systems emphasize clarity and reliability. Furuno often uses a grayscale palette rather than color, which can be superior for detail work because it relies on brightness rather than color to convey information.
Furuno's frequency options and gain controls work the same way as other brands. If you're comfortable reading sonar on a Garmin or Humminbird, you can read a Furuno unit with minimal adjustment.
Common Mistakes When Reading Sonar Fish Finders
The most common mistake is trusting sonar too much without understanding what you're looking at. A blob on the screen might be a fish, debris, or a processing artifact. Another frequent error is setting gain too high. When everything on your display is bright and colorful, it usually means noise rather than reliable information.
Misinterpreting the time axis is surprisingly common. Your boat's movement across the display represents time passing, not lateral position. A fish that appears on the left side and moves to the right is moving through time as your boat passes over it.
Troubleshooting Screen Artifacts and False Echoes
False echoes are duplicate returns that appear at regular depth intervals below the true bottom, caused by sound bouncing between the bottom and surface. They're usually dimmer than the true bottom. Slight gain reduction usually minimizes them.
Side-lobe interference occurs when the sonar cone's edges pick up returns from objects outside the main beam. Reducing gain or switching to a narrower cone angle helps. Turbulence noise appears as a grainy, speckled background, usually when your boat is moving fast or in rough water. Slowing down or repositioning your transducer away from the turbulence zone fixes this.
Mobile App vs. Dedicated MFD: Choosing the Right Tool
Many modern fish finders connect to mobile apps via WiFi or Bluetooth. Mobile apps typically show a delayed or lower-resolution version of what your dedicated display shows. For serious fishing, a dedicated display mounted on your console is the right choice. Mobile apps excel for monitoring sonar while you're away from the helm.
Mastering Your Fish Finder: Key Takeaways
|
Concept |
Best Practice |
Why It Matters |
|---|---|---|
|
Frequency Selection |
High (200 kHz) in shallow water, Low (50 kHz) in deep water |
Balances detail and range for your fishing depth |
|
Gain Adjustment |
Set until light gray background with minimal speckles |
Prevents noise while maintaining target visibility |
|
Color Interpretation |
Red = strong return, Yellow = medium, Blue = weak |
Helps distinguish fish, structure, and bottom type |
|
Bottom Reading |
Hard bottom = bright colors, Soft bottom = dim colors |
Identifies structure where fish congregate |
|
Fish Arches |
Complete arch = fish you passed over |
Smooth curves are fish; jagged lines are noise |
|
Thermocline |
Horizontal band in water column |
Fish often concentrate at this boundary |
|
Transducer Placement |
Clean water flow, proper mounting angle |
Directly affects sonar accuracy and reliability |
Learning to read sonar is a skill that improves with time and experience. Start with the fundamentals: understanding color, recognizing fish arches, and reading bottom structure. Once comfortable with those basics, explore the advanced features your specific unit offers. Every brand, Garmin, Humminbird, and Furuno, shares the same underlying sonar physics.
The difference between a casual angler and a serious one often comes down to how well they interpret their sonar. Invest time in learning your unit's capabilities and practicing in different conditions. The payoff is consistent, productive fishing trips where you know what's below your boat and can make informed decisions about where to fish.
Whether you're running a Garmin, Humminbird, or Furuno unit, understanding how to read fish arches, interpret colors, and identify structure will transform your fishing. At Elliott's Tackle & Rigging, we carry all three brands and can help you select the right sonar system for your boat and fishing style. Visit Elliott's Tackle & Rigging to explore sonar options that match your needs and get expert guidance on setup and optimization.
Frequently Asked Questions
What do the different colors on a fish finder mean?
Fish finder color palettes indicate signal strength and echo intensity. Red typically represents the strongest returns (hard bottom, dense baitfish), yellow shows medium strength, and blue indicates weak signals. On Garmin, Humminbird, and Furuno units, warmer colors mean denser targets. Understanding this color gradient helps you distinguish between fish, structure, and noise interference on your sonar display.
How do I distinguish between fish and structure when reading sonar?
Fish typically appear as arches that move through the water column as your vessel passes over them. Structure creates solid, stationary lines along the bottom. Baitfish show as clouds or clusters, while debris and vegetation create scattered echoes. Learn your specific brand's signature—Garmin, Humminbird, and Furuno each display targets slightly differently. The key is observing how targets behave across multiple passes over the same area.
What is the best sonar frequency for finding fish?
Frequency choice depends on water depth and conditions. Higher frequencies (200 kHz+) provide better target separation and detail in shallow water but don't penetrate deep. Lower frequencies (50 kHz) reach deeper water but show less detail. Most anglers use dual-frequency transducers, switching between high for shallow structure and low for deep water exploration. Garmin, Humminbird, and Furuno all support frequency adjustment in their settings menus.
How do I reduce noise and interference on my fish finder display?
Adjust your gain and sensitivity settings to filter out interference without losing legitimate fish targets. Start with moderate gain and increase only if you're missing fish. Check transducer placement—port and starboard mounting affects signal quality. On Garmin units, use noise rejection filters; Humminbird offers interference suppression; Furuno has similar noise-reduction features. Proper transducer orientation and secure mounting prevent vibration-induced artifacts on your sonar screen.
0 comments